As a digital ant, I always dig the Internet looking for relevant stats for my next campaign. It is an important process to optimize my marketing campaign accordingly and stay informed about the latest trends in digital advertising. However, finding quality online marketing stats is not always easy and consumes hours of time.
I have collected an important list of items over time we thought were worth sharing for those looking to create their next marketing campaign, pitch a prospect, or convince a colleague or simply look smart at parties. Therefore, without further ado, here is a list of 33 online marketing statistics, which will surely help make your marketing world a little clearer and easier.
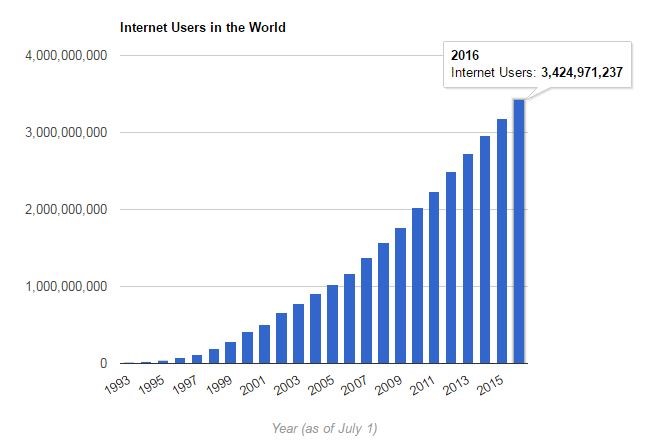
1. Internet usage growing at a steady rate of 2-3% per year. It is expected that 80-90% population will be online in the next 10-15 years.

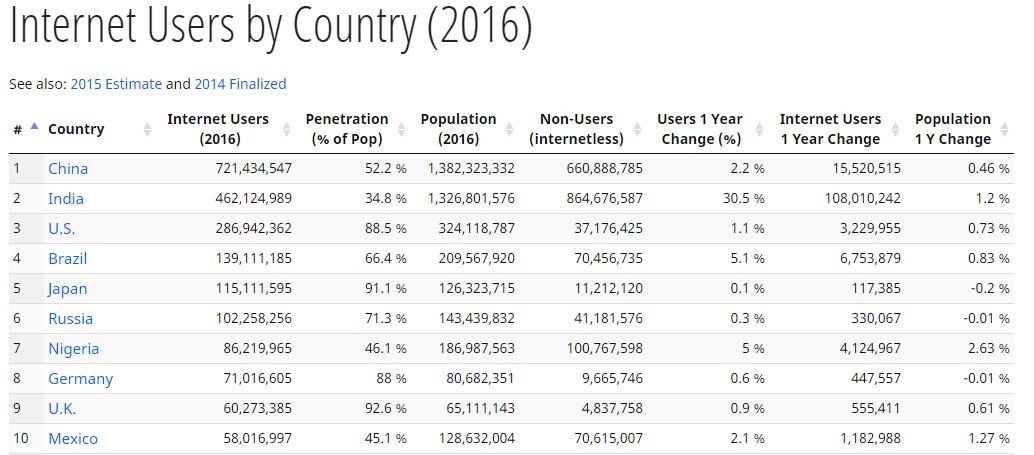
2. It was 462 Million internet users in India only in 2016 followed by US having 286 Million users. It is growing by ~30% YOY. China is at first place with 721 Million internet users.

3. Only 40% of the world population is using the internet in 2016. Still more than 50% market is untouched.
4. 87% of internet users now have a smartphone. (Source: Global Web Index)
5. 50% of Search Queries on the internet are 4 Words or Longer. (Source: WordStream)
6. On average Google processes over 40,000 search queries every second, which translates to over 3.5 billion searches per day and 1.2 trillion searches per year worldwide. (Source: Internetlivestats)
7. Every second, on average, around 6,000 tweets are tweeted on Twitter, which corresponds to over 350,000 tweets sent per minute, 500 million tweets per day, and around 200 billion tweets per year.
8. 2,577,356 Emails sent in 1 second, of those ~67% are SPAM.
9. The average click-through rate (CTR) of display ads across all formats and placements is 0.06%.
10. It’s been encountered that at least 309 million people are blocking ads on the mobile.
11. A study revealed that only 2.8% of users on the internet think that ads on the website are related.
12. According to a study, 54% of internet users do not click banner ads, as they do not trust them.
13. The retail industry contributes 9% of the revenue in Digital Advertising.
14. As of the end of 2015, the top social media channels used by small businesses were Facebook (41%), LinkedIn (17%), Google+ (13%), and Twitter (12%) according to Ebiquity.
15. 93% of small-medium organizations use social media as their main content marketing tactic.
16. 94% of B2B marketers give priority to LinkedIn to distribute content.
17. Visual content is 40X more likely to get shared on social media than any other type of content.
18. Content with relevant images gets 94% more views than content without relevant images. (Source: Kiss Metrics)
19. 71% of online marketers use visual assets in their social media marketing.
20. Content marketing costs 62% less than traditional marketing and generates about 3 times as many leads. (Source: Demand Metric)
21. On Facebook posts with images see 2.3X more engagement than the posts without images.
22. 45% of marketers say blogging is their most important content strategy.
23. 82% of marketers who blog see positive ROI for their inbound marketing.
24. 90% of Twitter video views happen on a mobile device.
25. 28% of the total B2B marketing budget is spent on content marketing.
26. Around 78% of queries are searched on Google only while Yahoo serves only around 6% search queries. Rest divided into Baidu(China), Yandex(Russia) and Microsoft(Bing), etc search engines.
27. 87% of Twitter’s revenue comes from advertising.
28. Around 90% of Google’s entire income comes from advertising.
29. Digital Ad Spend is expected to be $112 billion up to 2020.
30. 72% of Consumers who do a local search visit a store within 5 Miles.
31. Click-to-Call commerce will reach $1 Trillion in 2015 and Double by 2019.
32. You Lose 97% of Leads on Leaky Landing Pages.
33. Calls to businesses are worth 3X more than click to the website.


